A guided tour of Navigator.
Follow the path a new account takes: see the whole picture, drill into each asset type, then slice it however you need. Every section links straight into the docs.
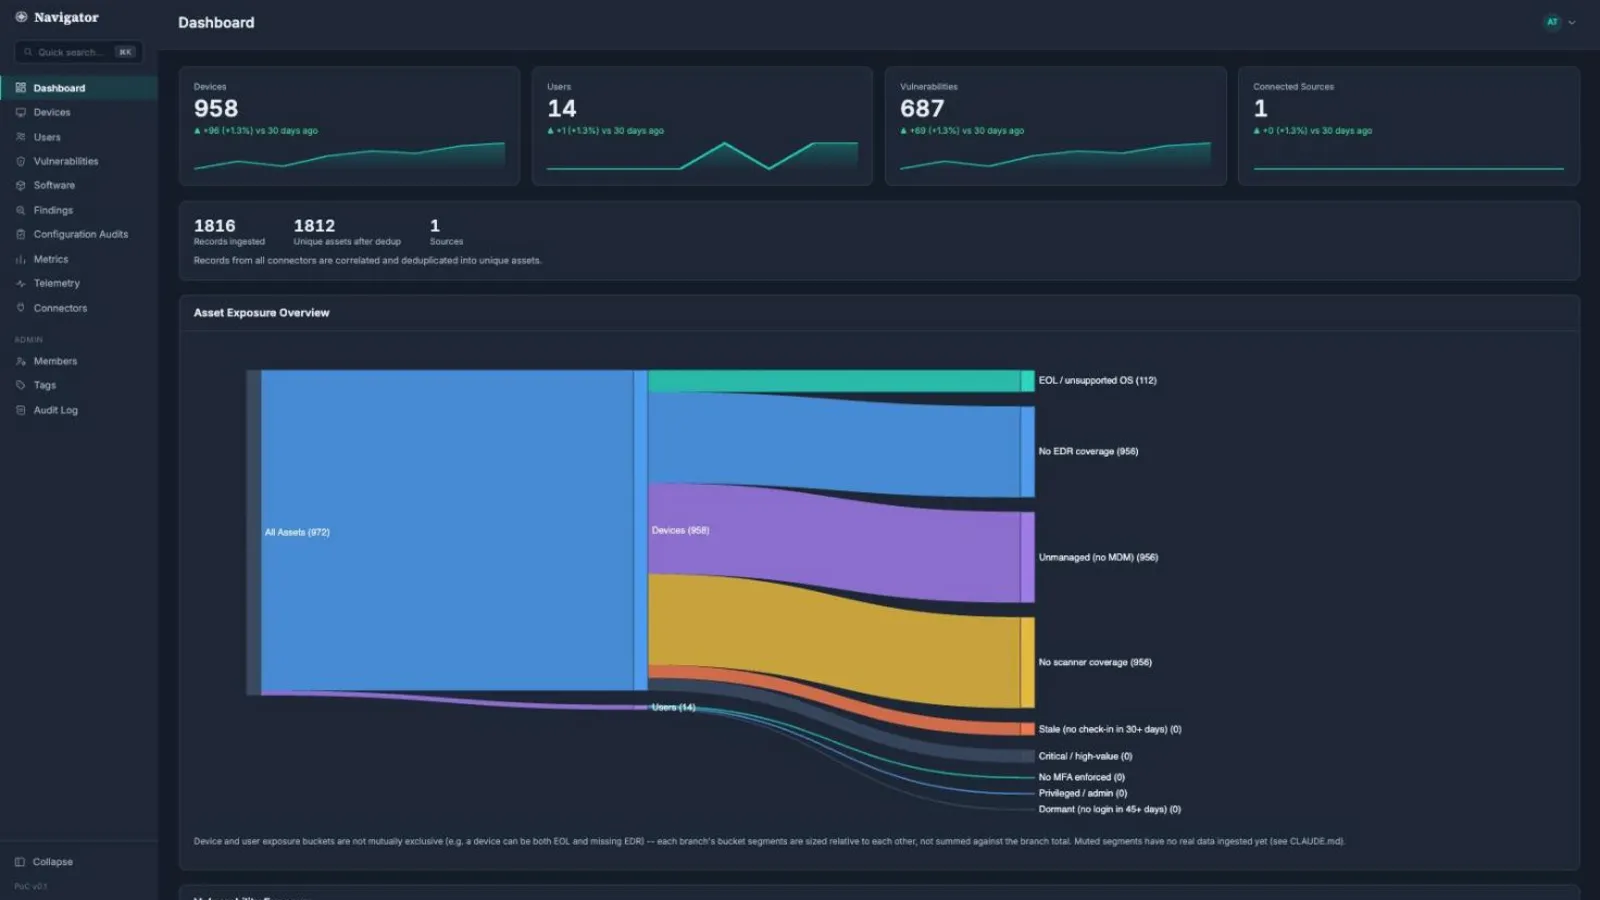
Dashboard
A real-time summary of asset counts, coverage gaps, and connector health across your whole environment. Missing EDR, unmanaged devices, and stale endpoints surface here automatically. It's your starting point every day.
Read the Dashboard docs →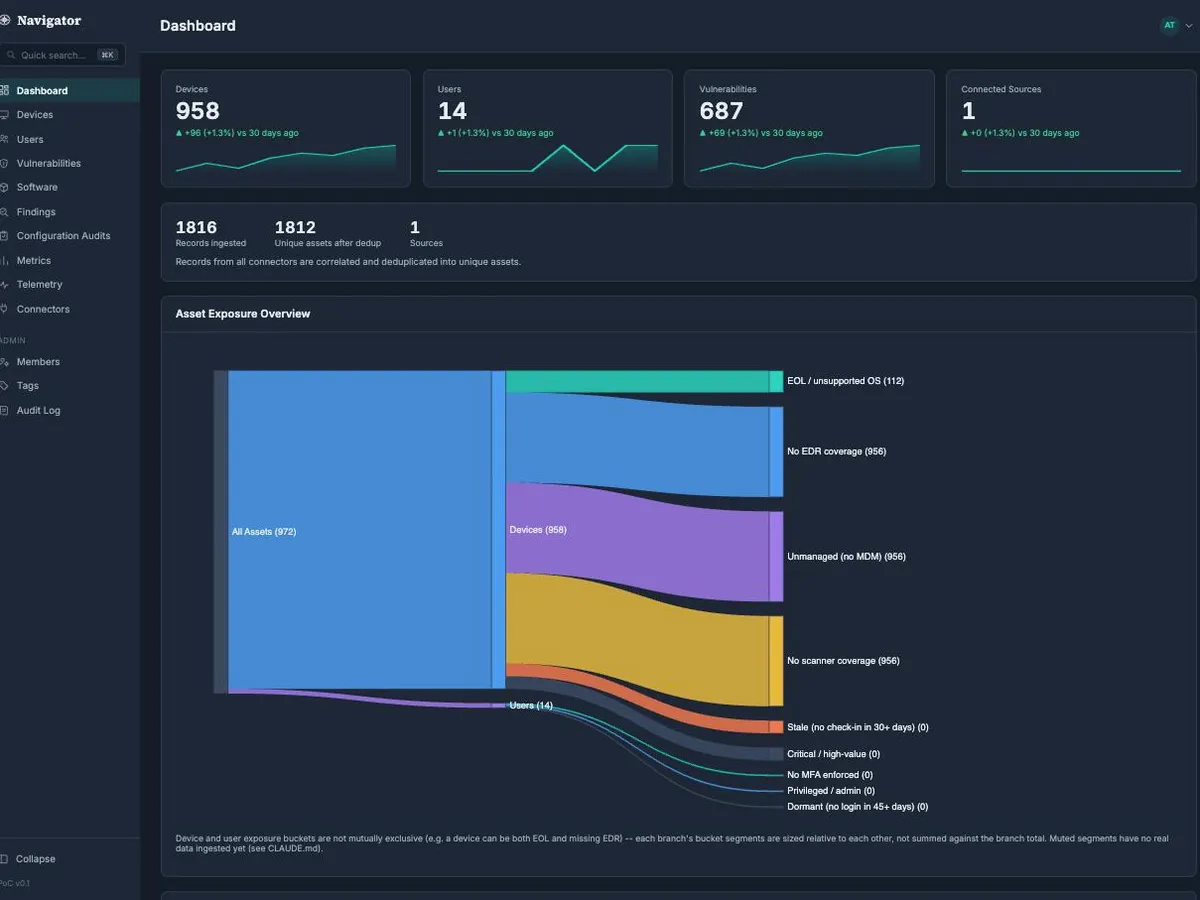
Devices
Every device consolidated across all your connectors (laptops, servers, and other endpoints), deduplicated into one row each, with hardware, OS, encryption status, and agent coverage.
Read the Devices docs →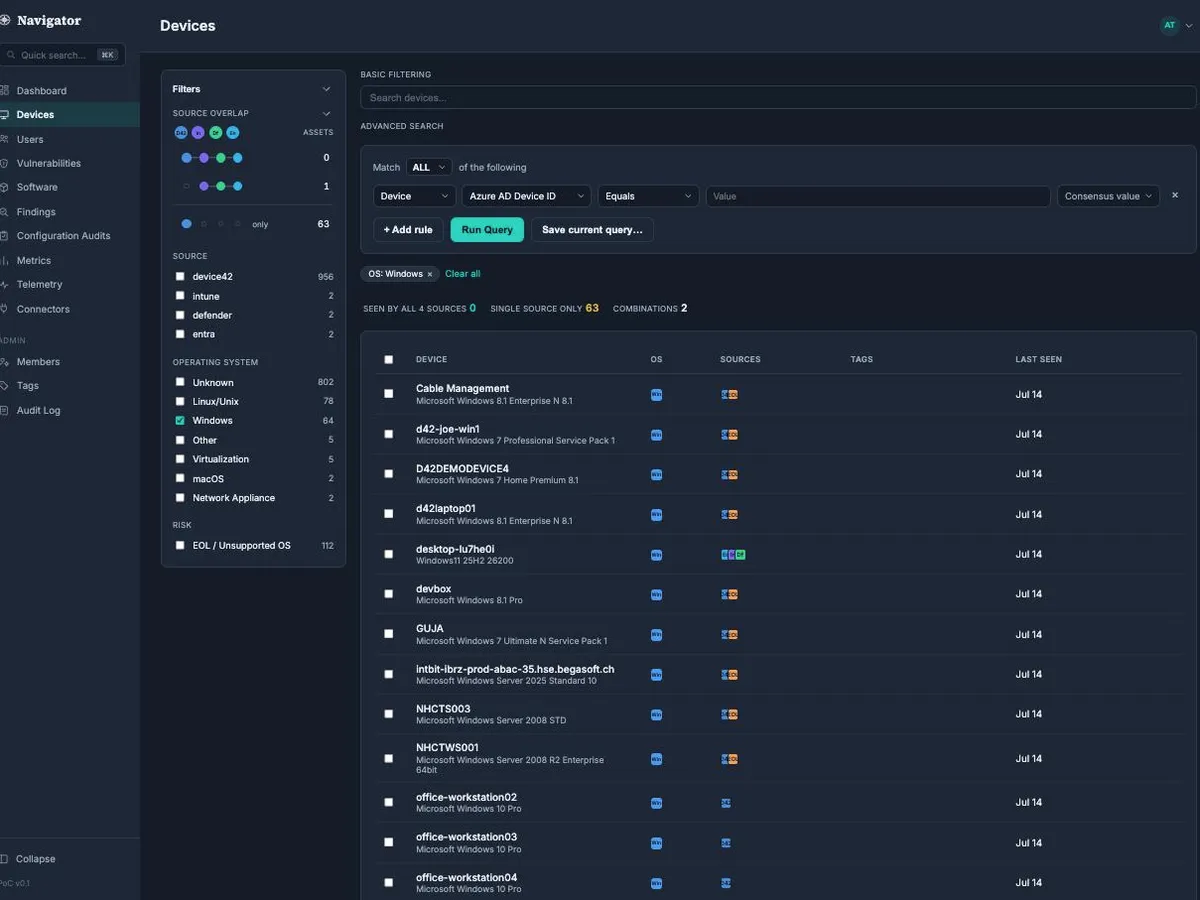
Users
Every directory account consolidated across your identity and endpoint connectors, with MFA enrollment, admin status, and the devices each account is associated with.
Read the Users docs →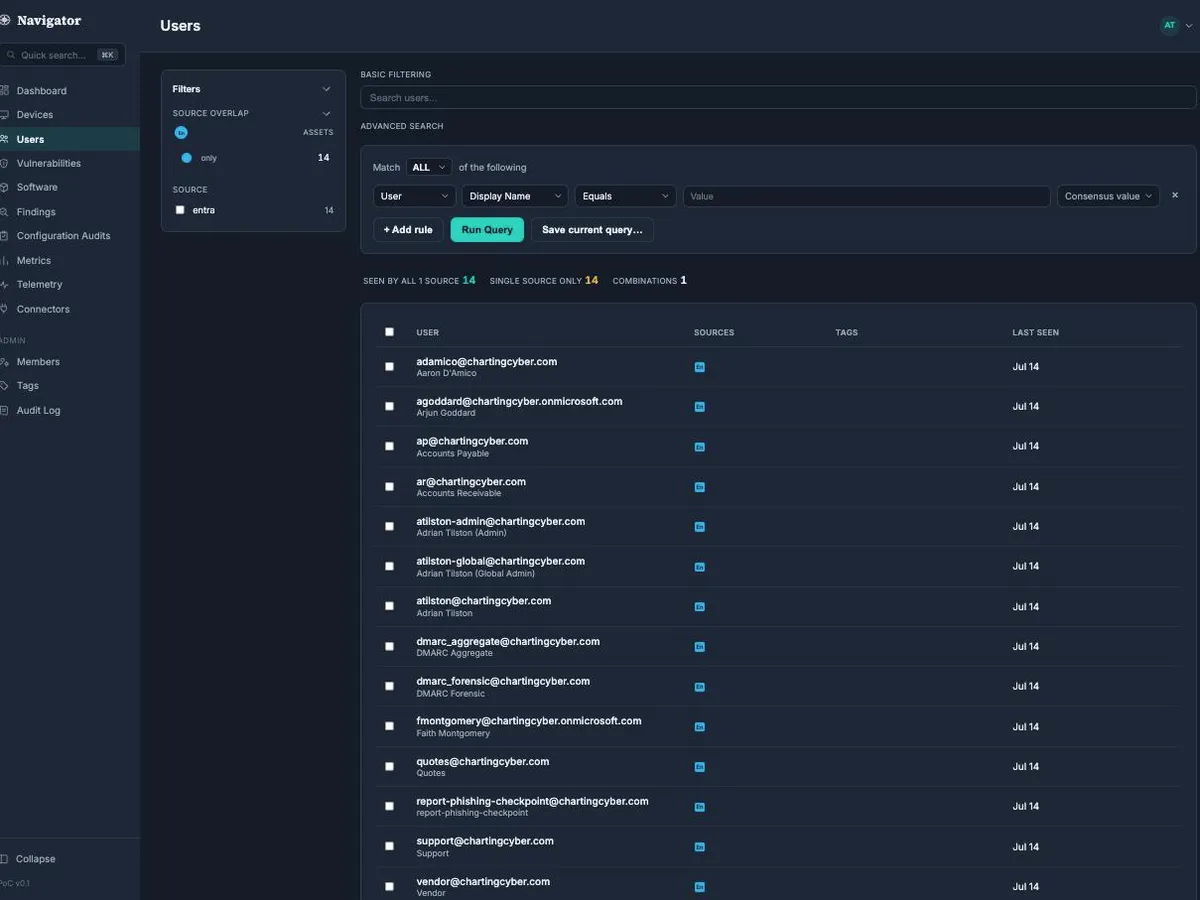
Vulnerabilities
One row per unique vulnerability, with a count of how many devices it affects, enriched with CVSS, EPSS, and CISA/VulnCheck known-exploited data so you can triage by real risk, not raw severity.
Read the Vulnerabilities docs →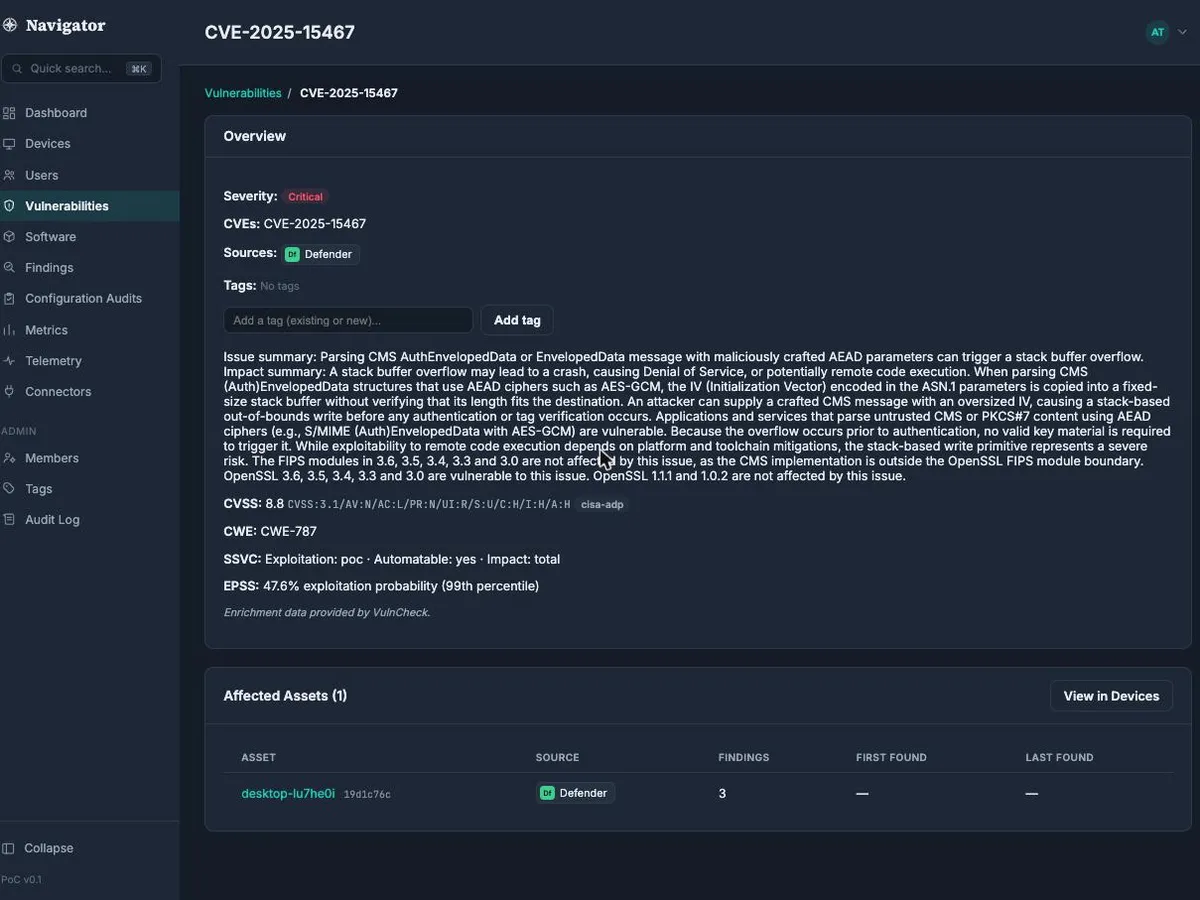
Advanced Search
A rule-based query builder across Devices, Users, Vulnerabilities, and Software, including rules that reference a different asset type than the page you're on.
Read the Advanced Search docs →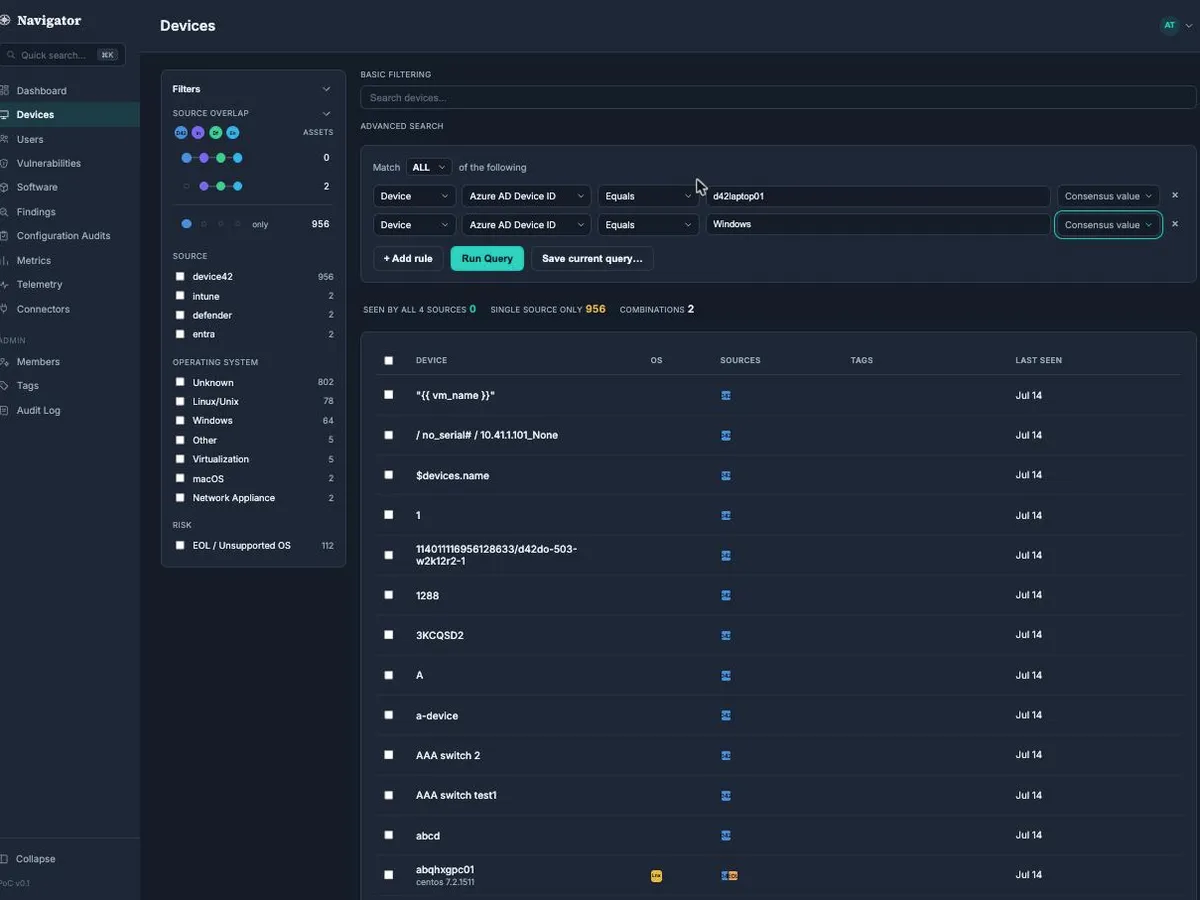
Visible in the product, still being built.
These pages exist so the intended experience is visible ahead of the underlying capability shipping. They're flagged the same way in the product and the docs.
See it against your own environment.
Connect one tool and the tour above fills with your real, consolidated data in minutes.